Matias Peruyera

I’d call myself a graphic designer, but that would leave out many other skills in editing, writing, infographics, data visualization, typography, programming, illustration, and perhaps the main one: knowing how to identify the best resource for each situation. I absolutely love print, but I'm also fascinated with the possibilities of interactive media.

My resume (PDF). You can also send me an old-fashioned email.

Scholar stuff: my Academia.edu profile.

News Graphics

Graphic design and information architecture at the service of journalism, for those situations in which texts and photographs do not tell the full story.

← Voltar

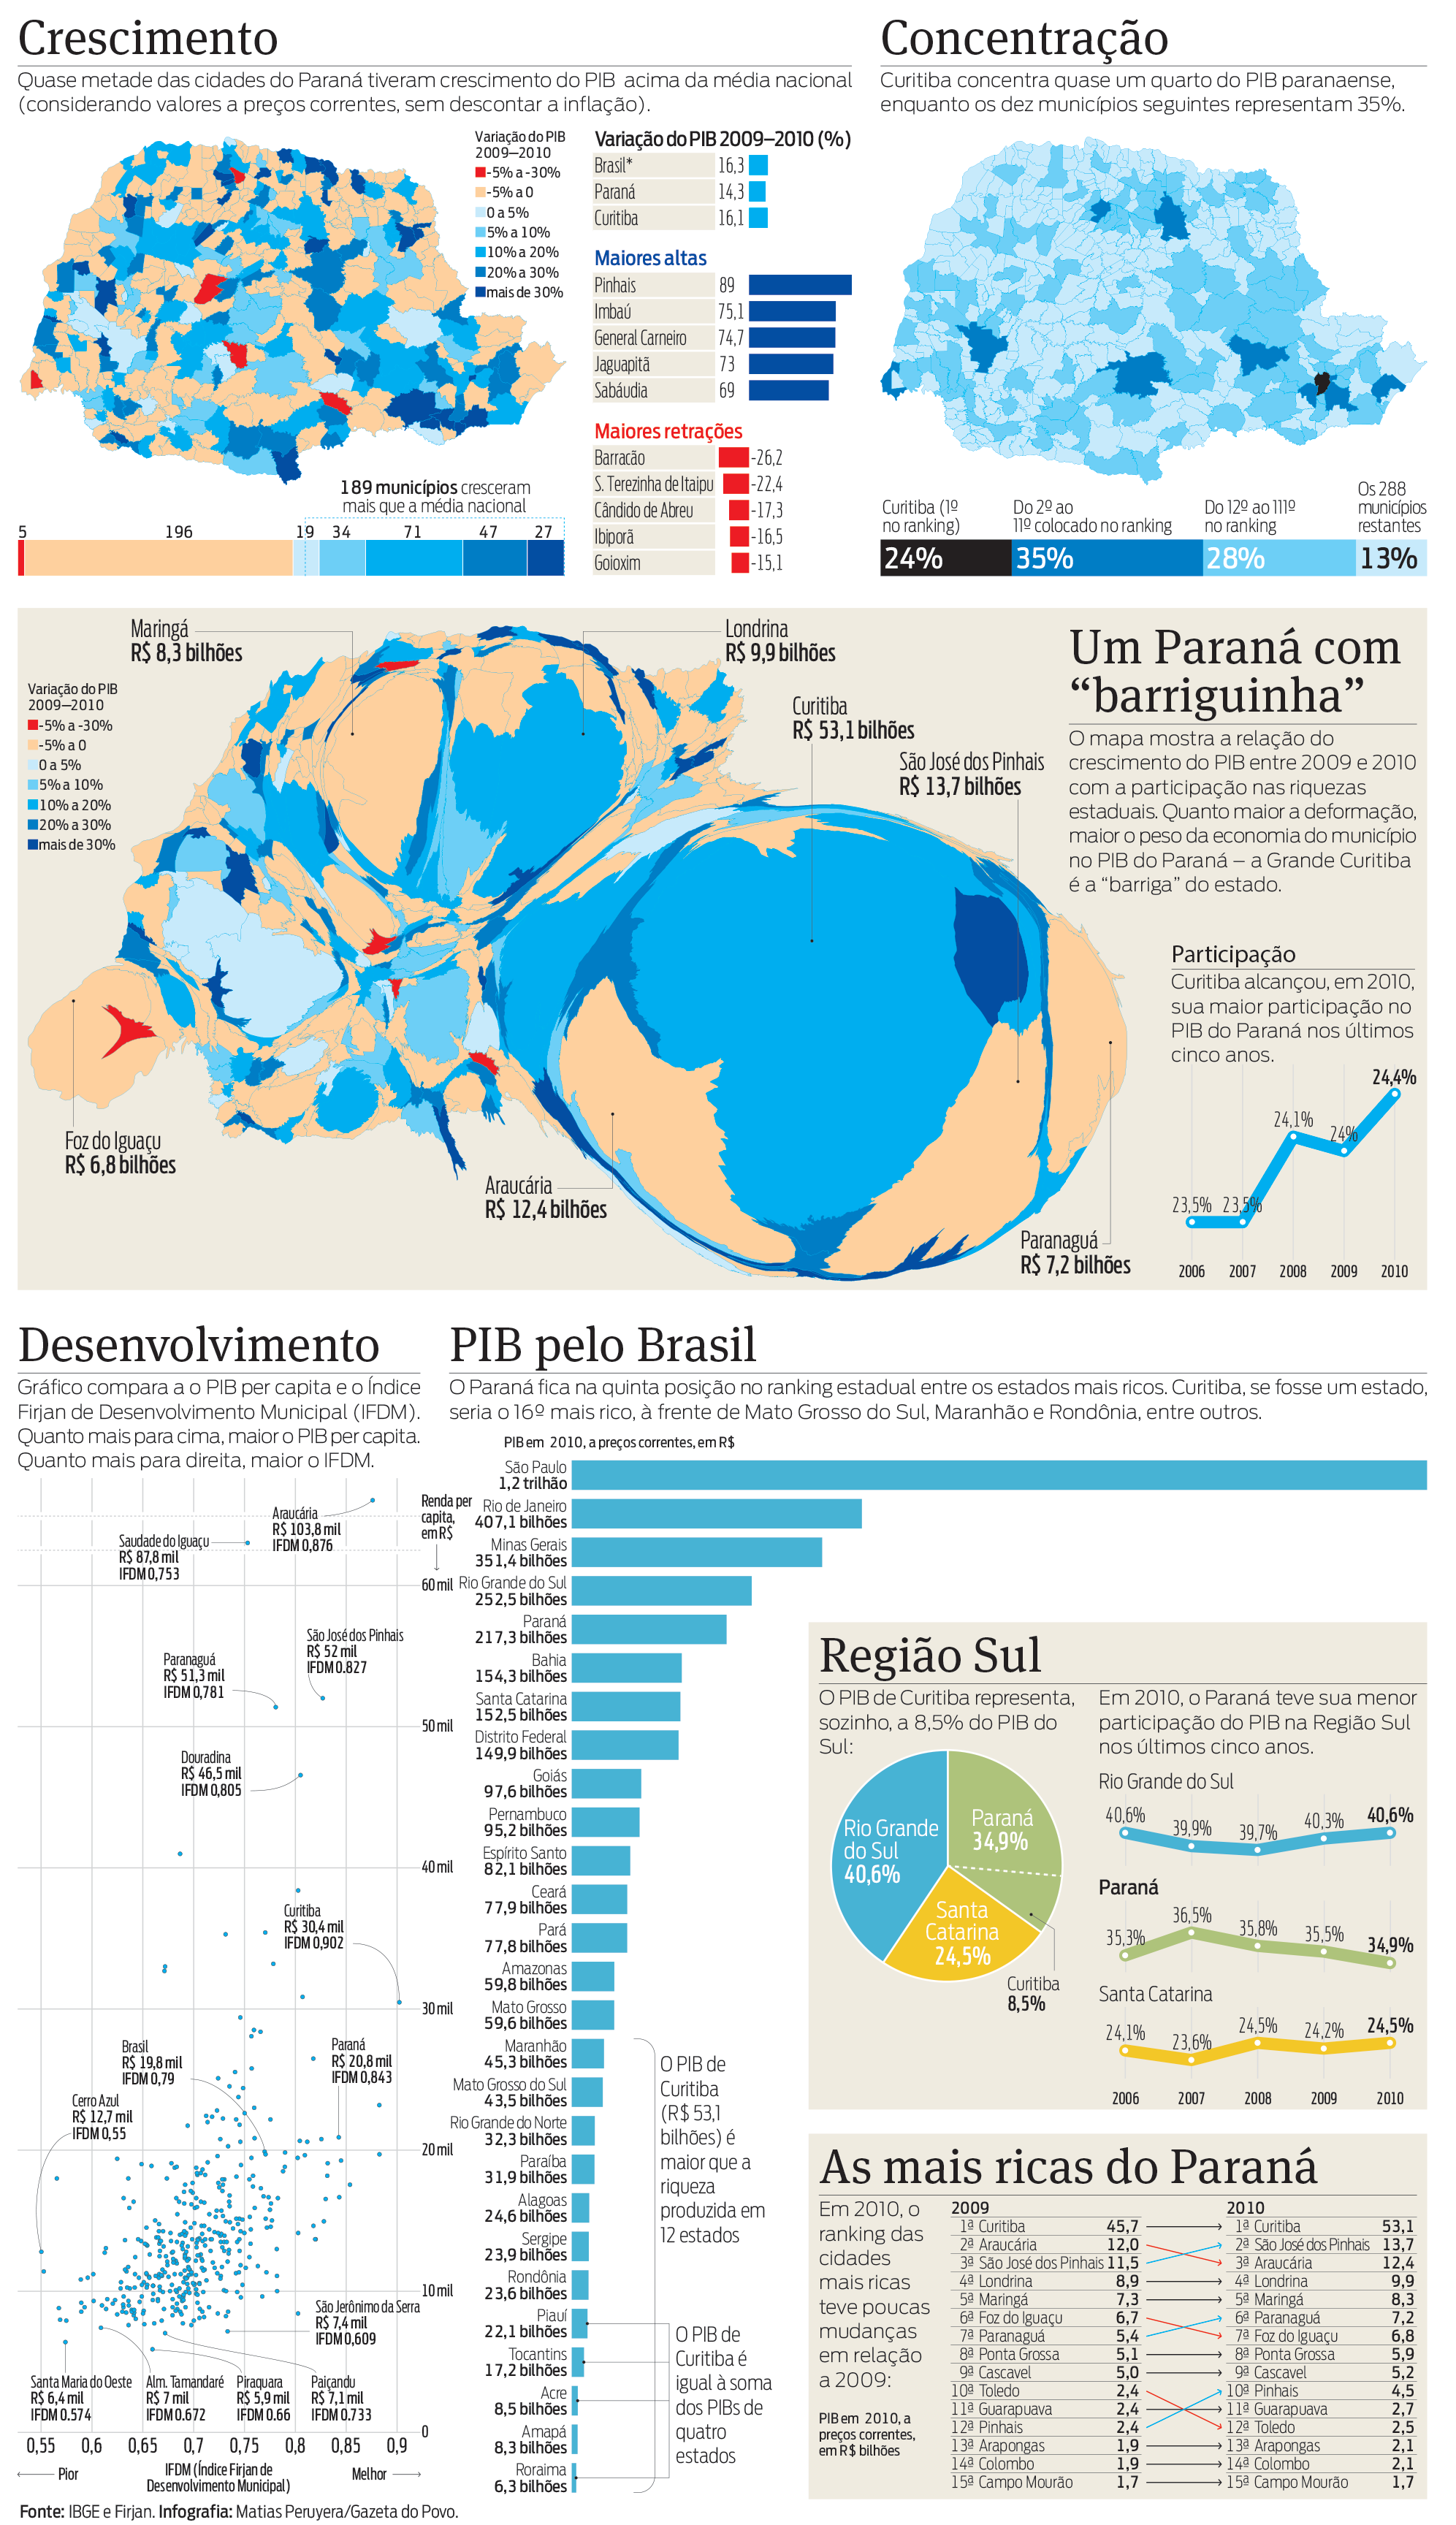
Paraná State GDP Visualizations 

The abundance of data, in some situations, hinders rather than helps. In this case, I took the data from the reporter's hands to explore it visually and choose the best visualizations for a full-page infographic. After selecting the views, the reporter prepared texts to present each one.

The tools used included vector tools – Freehand and Illustrator –, spreadsheets, Processing scripts, QGIS for processing the maps, and some obscure software to proportionally modify the areas of the municipalities.

← Voltar